


All about that base load
You've been thinking about base load incorrectly.

The topic of nuclear in Australia ran hot for most of 2024, reaching a crescendo in the weeks prior to Christmas when Frontier Economics released their estimated costings for a nuclear future (you know, work the Coalition promised they’d release prior to Christmas yet somehow Frontier ended up doing it pro bono…)
Amongst the various talking points that have been batted about in the discourse, one that received plenty of attention is the question “can renewables provide base load?” The answer is yep.
Short newsletter this week. See you next time.
…
…
… except, unfortunately some of Jim Henson’s finest have devoted significant brain cells to muddying the waters around what base load is and is not.
Let’s explore.
System demand
Electrical grid demand (aka system demand) reflects the underlying consumption patterns and preferences of the people utilising the grid — the shape of electricity consumption is far from flat, varying significantly over the course of the day, week and year.
A good way of visualising this variability is via a load-duration curve. The curve below shows the system load for South Australia across FY16 (June 2015 – July 2016). The curve can be read as 100% of the year the load was above ~600 MW (i.e. this is the minimum system load ever observed during the period), and 30% of the of the year the load was above 1,500 MW, etc.
Significantly the curve becomes extremely steep on the left hand side of the chart – there’s something like 800 MW which is only required for less than 5% of the year (when it’s very hot or very cold).

This variability is a feature, to a greater or lesser extent of every electricity grid, and has been something of a headache for grid designers since roughly day dot.
Why does the variability matter?
Turbines
Turbines, whether powered by steam, water (hydro-electric), gas or even wind, have non-linear efficiency curves; turbines have a level of operation where they’re most efficient, and power outputs above or below this level are increasingly less efficient.
Putting all other design challenges aside — in order to build a single machine big enough to meet this variable system demand, including the peak load, we’d need to operate the machine varying output levels meaning it would have low efficiencies for much of the year, wasting fuel and driving up operating costs. The steeper that peak demand duration tail is, the worse the efficiency of our theoretical giant turbine.
Since engineers can design turbines to maximise the efficiency against the desired power output – matching the size and design of the turbine to its intended use – this suggests that economically (and practically) it would be most efficient to use a combination of different machines to meet the variable system demand.
Historically, a useful paradigm to think of this generation mix is via a three tiered classification for the generators:
Base load generation – generators which are always on, operating at close to a constant level equivalent to approximately the base load, i.e. the minimum demand always present on the system.
Load following generation (also known as intermediate or mid-merit) – generators which will constantly vary output to meet the fluctuating demand above the base load.
Peaking generation – generators which are required to only run for very short duration over the year; in some years this might only be a handful of hours.
Re-introducing the load-duration curve from above with its original annotations, we can more clearly see how the different generation types are utilised throughput the year. For example peaking generation here is represented as 10% of the year, or a little over one month.

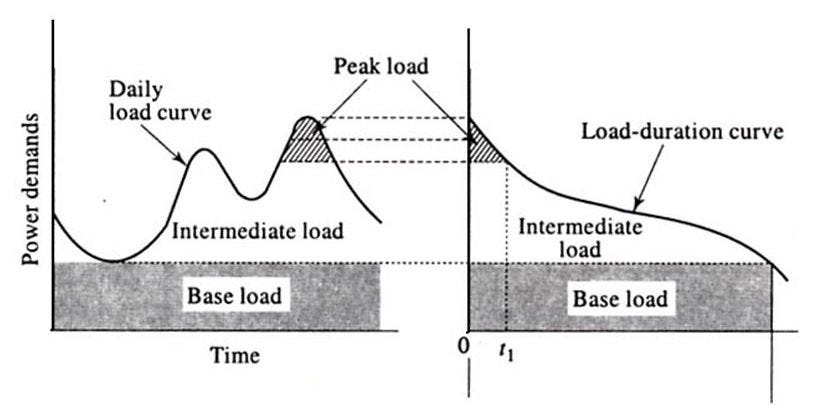
An alternative way of visualising the contribution of each generation type is to think about the variability on a daily timescale. The next figure below compares the daily load shape with a load duration curve. It shows the variability on both a daily (left hand side) and annual timescale (right hand side).
One additional point worth noting, is that while this classification is helpful in terms of system design, there are no clear cut rules around precisely what the mix of each class is.
Can base load generators also contribute to some of the intermediate load (the answer is generally yes), if so how much? At what point should load following generation cut over to peaking generation — 2%, 5%, 10% of system peak demand?
In the days of the state electricity commissions these questions were slightly easier to answer, because generation was dispatched on an almost purely merit order basis. The control rooms knew the precise fuel and operating costs of each generator within their fleet and chose to dispatch the generation in order to minimise the total system cost at any given time.
These distinctions are more complicated in a liberalised electricity market where mostly private companies operate generators in order to turn a profit. Competing generator bids are based around profit-maximising strategies, not just reflecting underlying costs.
Base load
Considering the concept of base load and its history, we’re talking about two things separate but related things:
The literal ‘base load’ — the minimum constant load of the system.
The combination of generators, historically turbine-based, designed to which run as close to their peak efficiency point as possible to supply this minimum constant level of electrical load, in order to achieve the lowest operating cost.
The power system was designed with these “base load” generators operating at peak efficiency because it was the cheapest way to operate the power system.
The definition of base load generation is not so much about its operational characteristics, but its economic characteristics.
Base load generation evolved as a means to design a power system to cost-effectively supply the demand curve. Because there is a base-level of load, large generators could be designed to operate near steadily at their level of maximum efficiency. All of this is done to minimise the total costs of operation, at the system level.
So while base load is a useful classification for the type of generator (or more correctly, the mode of operation) required, it’s not actually a characteristic of the generator itself — it’s a characteristic of the system.
For the debate happening now around the concept of base load, this is the key point:
Base load is a property of the system.
Enter renewables
The last two decades has seen the rapid rise of variable renewable energy – wind and solar – across grids around the world. Leaps and bounds in technological improvements matched with plummeting capital costs scarcely imaginable at the turn of the century have ensured their place in the mainstream of electricity grids.
There are two significant points:
Firstly, variable renewable energy doesn’t fit neatly into the traditional three tiered classification system. These technologies are characterised less by their operating costs (which are close to zero), but by the availability of the wind or solar resource (or what we in the business call “weather”).
Secondly, the rise of rooptop PV1 has led to structural changes in the shape and nature of system demand. Australia, which has rooftop PV installed on some 40% of residential homes, is seeing this acutely in the rise of “minimum system load” where the base load of the system is dropping to increasingly lower levels. South Australia is an extreme case, with minimum demand often going negative.2
The availability of very low cost generation creates a new paradigm for overall system design. The cheapest power is no longer provided by very large turbines operating at peak efficiency. Instead, it comes from sunny and windy periods. The lower costs of solar and wind are especially true when you factor in the additional (currently unpriced) environmental costs of burning coal and gas to make electricity.
If we think about system design in this new paradigm – and we care about designing grids to minimise both costs and emissions – what we actually need to design around is the geographical coincidence of weather. Particularly in a grid as large as the NEM, we can plan the location and mixture of wind and solar farms in order to maximise the continuous output of these units.
This is the new idea of ‘base load’ and load following — overbuilding a portfolio of variable renewable generators which will provide a near-constant output in aggregate. Because while ThE SuN MiGhN’T AlWaYS sHiNE aND ThE WiNd MiGhN’T AlWaYS BLoW in a specific location, it is remarkably windy and sunny across large chunks of the country, which we can use to our advantage.
And because the operating costs of these assets are extremely low – near zero – they fulfil the criteria of providing the cheapest overall system cost.
Challenges and criticisms
This transition away from a base load (and largely load following too) provided by coal-fired generation however isn’t without challenge or criticism.
For one, the reliance on weather creates long-term reliability challenges. For while we can sustain long periods of high aggregate outputs across both wind and solar, there are periods of combined wind and sun droughts — known by the wonderfully German term dunkelflaute – which see the aggregate wind and solar production drop precipitously.
The duration and severity of these events is unclear — estimates range from a few days every few years to a week or more on an annual basis — but there’s no denying that this is a real problem to be addressed. And unlike short-term weather forecasting which we’ve become quite sophisticated at, long-term weather models are incredibly difficult.
Another key challenge to the paradigm of renewable generation is the location of the generation assets and the poles and wires required to distribute that energy to where the load is (primarily the capital cities). The existing infrastructure of the NEM is based around large coal generation typically at the mine mouth, with limited transmission corridors back to the large cities. Unsurprisingly, we don’t have sufficient existing transmission capacity into the regions of Australia which are the sunniest and windiest, and we need to build them.3
This will cost money, and reports like the AEMO Integrated System Plan which have laid out plans and budgets for how to build this future have become politically contentious documents. The ISP is not without criticism, but the core challenge remains — key parts of the NEM are built on a series of unpaved backroads and we’re in need of a few more freeways.4
A final key challenge to a system dominated by wind and solar is that these technologies are non-synchronous. They generate power in direct current (DC) and use inverters to convert the power to alternating current (AC). The current inverter technology used simply spits out an AC signal matching whatever the prevailing grid conditions are, which works now, but with increasing levels of renewable penetration will become an orchestra without conductor, looking at each other for timing cues.
There are technological solutions to this, including things like using grid-forming inverters or synchronous condensers, but ultimately the solution will require further regulatory intervention to ensure that all renewable projects meet the required standards of system strength.
Each of these challenges are known knowns, and the energy industry at large is currently working on developing solutions. That doesn’t mean they’re fully solved, but there’s also a large body of work to demonstrate that none of these challenges are significant enough that the system can’t be operated on high percentages of renewables.
One last criticism commonly bandied about is that this new paradigm of relying on variable supply to meet a fixed demand is a case of the tail wagging the dog.
And sure, that sounds like a reasonable argument, until you also consider that grid designers have always encouraged people to minimise electricity demand during the peaks, flattening the system demand curve and pushing that energy into the intermediate and base load regions, minimising the cost of the system (and better suiting the operational characteristics of turbines).
It is the role of the system operator to minimise the cost of the system, and large variations in demand are one of the biggest challenges to be addressed — why would limit yourself to supply side tools only?
All your base [load] are belong to us
So, can renewables serve base load? Yep.

And to a lesser degree the broader ecosystem of distributed energy resources, like batteries and EVs, which introduce both flexible demand and generation or export capabilities.
This is possibly because excess generation flows over into Victoria.
We also need to build out improved interconnection between the NEM’s constituent states, which is honestly just picking up the work that should have been done over two decades ago. The lack of interconnection was criticised in the 1990s (and even earlier), and it’s still a problem.
BUT WE’LL BUILD NUCLEAR UNITS ON EXISTING COAL-FIRED SITES AND RE-USE THE EXISTING INFRASTRUCTURE! You scream. Will we now. How’s the community consultation going? What about the private companies which own the land of the former coal-fired stations? Is the existing power system configured to run on a limited number of very large units? Maybe that could be a year 12 assignment for someone — sitting down and actually planning the alt ISP. Easy to spend time writing column inches and recording LinkedIn videos, harder to actually do the work.
Oh, thank you. This has been delicious to read. Up until now I have been trying to debunk the distorted 'base load' concept by just pointing out how in the past domestic hot water systems (for example) were given over to being provided with heat by coal fired electricity in periods of low demand (e.g. early morning hours), just to give the generators something to do at night rather than winding down and earning less money. Thank you for a comprehensive briefing.
It is debatable that we need any more transmission,
1. Germany with far more variable wind/solar output than us and far less open space expects to be generating 1,800 MWh/square km/y within a decade from onshore renewables. Given more space and better wind and solar we should be able to generate 2,200-2,500 MWh/ per square km. If so we can supply all the load every load centre needs within less than 150 km of the load.
2. We are using only about 10% of our potential roof/carpark space for customer solar.
a) France is expecting to have 40 GW of carpark solar by 2030. That would be equivalent to about 20-25 GW here
b) A UNSW study a few years ago identified potential for 186 GW of rooftop solar, using 250W panels. With 10% more roofspace and 440-500 W panels we probably have space for a 350GW of rooftop solar
c) Unshaded north and west facing facades of office buildings and warehouses as well as solar windows have potential for something like 20-40 GW
Potentially we have 450GW of behind the meter solar which needs no transmission and even if curtailed down to an average 10% CF is 390 TWh, 50% more electricity than we use now.
3. Existing utilisation can be significantly improved:
a) Some of our transmission lines, particularly to hydro plants run at 20-30% capacity, floating solar or adjacent wind and solar within 1-15 km of the hydro substation could double or triple the annual utilisaton of the lines
b) by building hydbrid wind/solar systems with a relatively short duration battery, something like 20-25% of the nominal peak power for 4-6 hours, the transmission link to a wind/solar farm could run at 60-80% capacity rather than 25-35%
c) Dynamic rating of lines allows them to carry 20-50% more current on windy hot days or cold nights
d) reconductoring of lines with carbon fibre cored conductors allows them to double current carrying capacity for the same wind and structural load
e) building storage near the load like customer batteries, community batteries, substation and terminal station batteries like Swanbank or Epping then the 550kV lines can be running at high load from 11 AM rather than wait till 4-6 pm