
Renewable Rorschach Test
We're doing it. We're screencapping OpenElectricity.

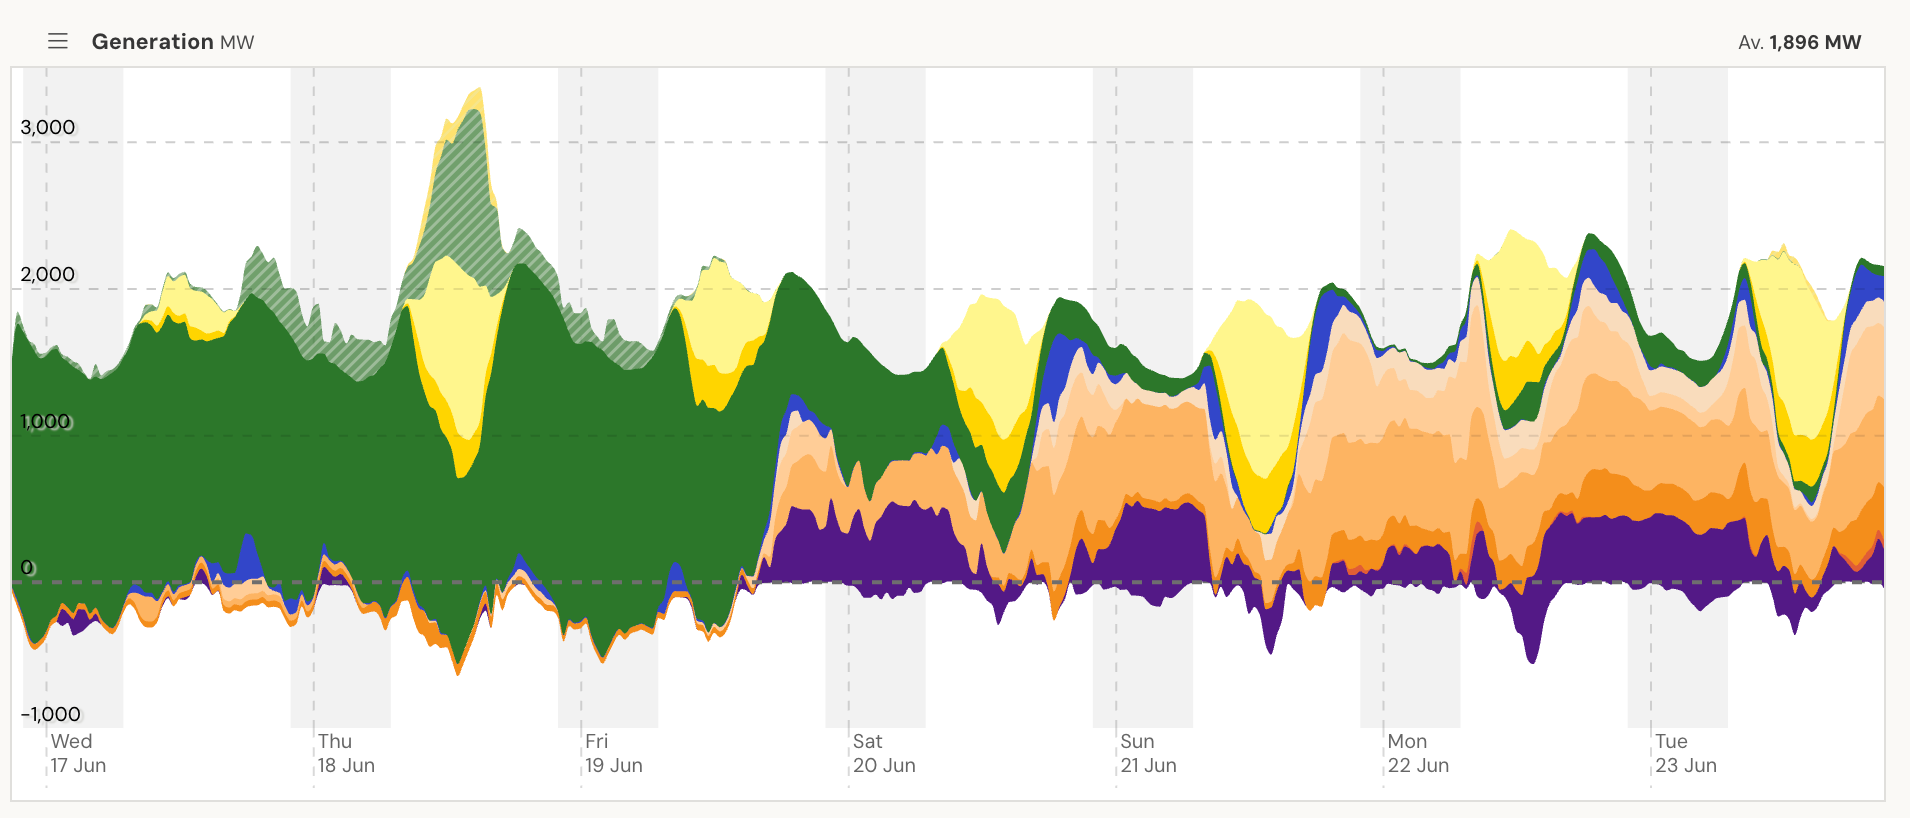
You might recognise the above image as a screencap from OpenElectricity. Specifically, you might recognise it as chart of South Australian generation output from little over a week ago.
Turns out it’s also a Rorschach test for the renewable transition.
This last week kicked off a discourse cycle on LinkedIn and elsewhere1. Depending on your views, politics and background knowledge there are a dozen different narratives you could extract from this single image.
Much of this discourse was pretty harmless – content to feed the ravenous maw of social media algorithms – but some of it was a bit more nefarious, and if you don’t spend all day looking at the dispatch mechanics of the NEM you might be left scratching your head.
Or worse… believing some of those posts.
So come and let’s read some tea leaves.
Narrative 1 — El Niño
Australia is currently experiencing an El Niño phase, which brings less rainfall and warmer temperatures, particularly in the southern states. If you’re into snow sports… not this winter you’re not.
Warmer temperatures directly correlate to lower peak electricity demands for winter heating — South Australia’s peak demand last week was 2,400 MW on Monday 23 June evening, with most evenings in the last week barely above 2,000 MW.
Compare this to typical winter peak demands ranging between 2,300 – 2,600 MW in SA, and summer peak demands above 3,000 MW.
iMaGiNe iF It wAs a cOlD WiNtEr! It cOuLd hAvE BeEn sO MuCh wOrSe!!!1!!1!
Narrative 2 – Wild Winds
Early in the week a dominant narrative was the sheer volume of renewable generation, primarily from wind. At its peak there was around 10 GW of wind blowing across the NEM, out of an installed capacity of 14 GW. It wasn’t a record, but it was certainly windy.
There are many lenses through which you can view this fact, including:
It was windy.
Post-privatisation South Australia has rebuilt its generation fleet around wind (and gas, but we’ll get to that shortly).
In a competitive privatised market the early movers were rewarded by building in windy areas connected to the transmission system, which yield higher capacity factors and higher project returns. The downside of this approach is a lack of geographic diversity across the wind fleet and a relatively correlated output…
Narrative 3 – Curtailment
… and with highly correlated output comes curtailment. South Australia is a small system, and with around 2.7 GW of installed wind there are times when not all of that wind can be utilised.
This curtailment is further exacerbated during the middle of the day, when wind competes with both grid-scale and rooftop solar.
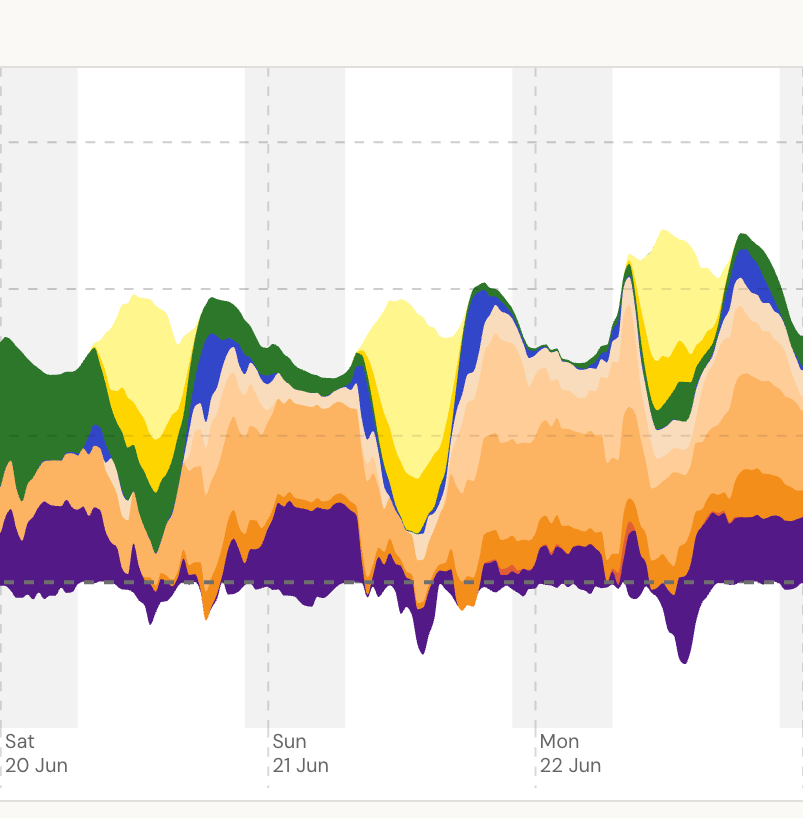
You can see this playing out in the big chunk of green shaded area in the headline image.
This is increasingly a feature of the shoulder seasons when the skies are clear and the weather mild… or an El Niño.
Narrative 4 – Negative Prices
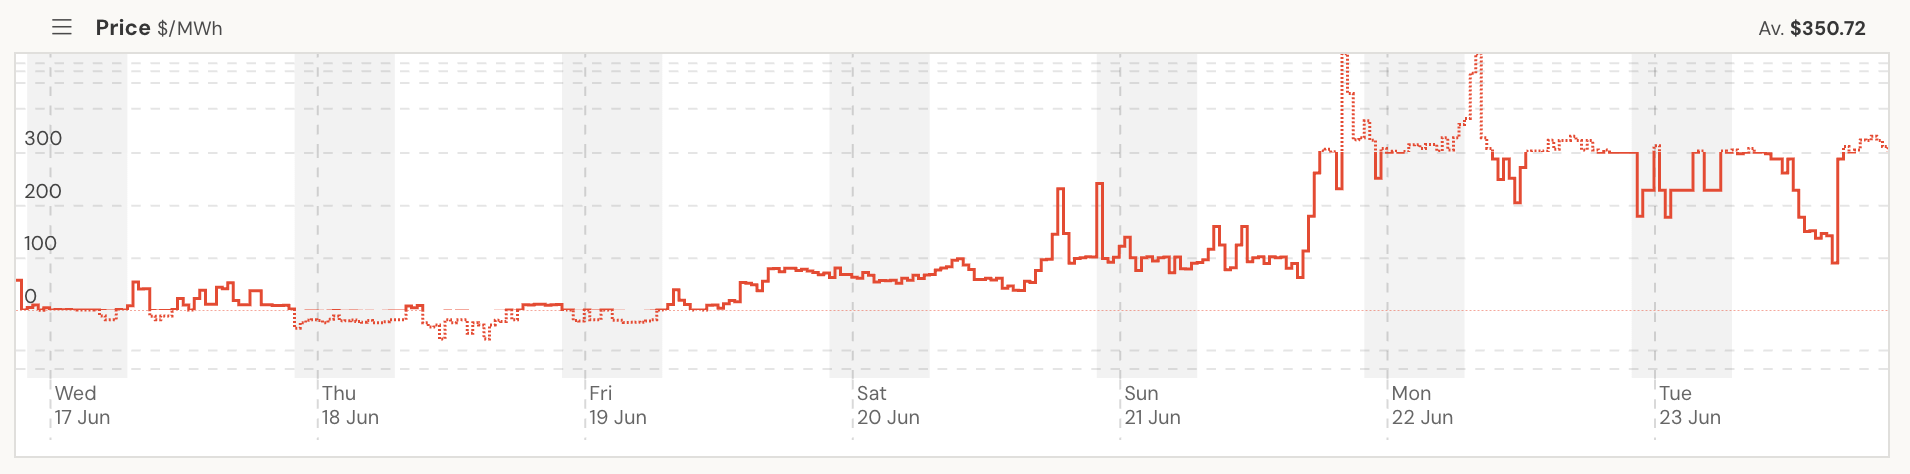
The deluge of renewable energy also brought very low prices, and on Thursday 18 June was negative for most of the day (corresponding to the significant curtailment seen).
We’ve written about the structural causes of negative prices before, and the last week was a textbook example.2
Narrative 5 – The Drought
With a highly correlated output, also comes risk of highly correlated non-output. Over the course of the weekend of 20-21 June the wind across the NEM died down to just a handful of megawatts.
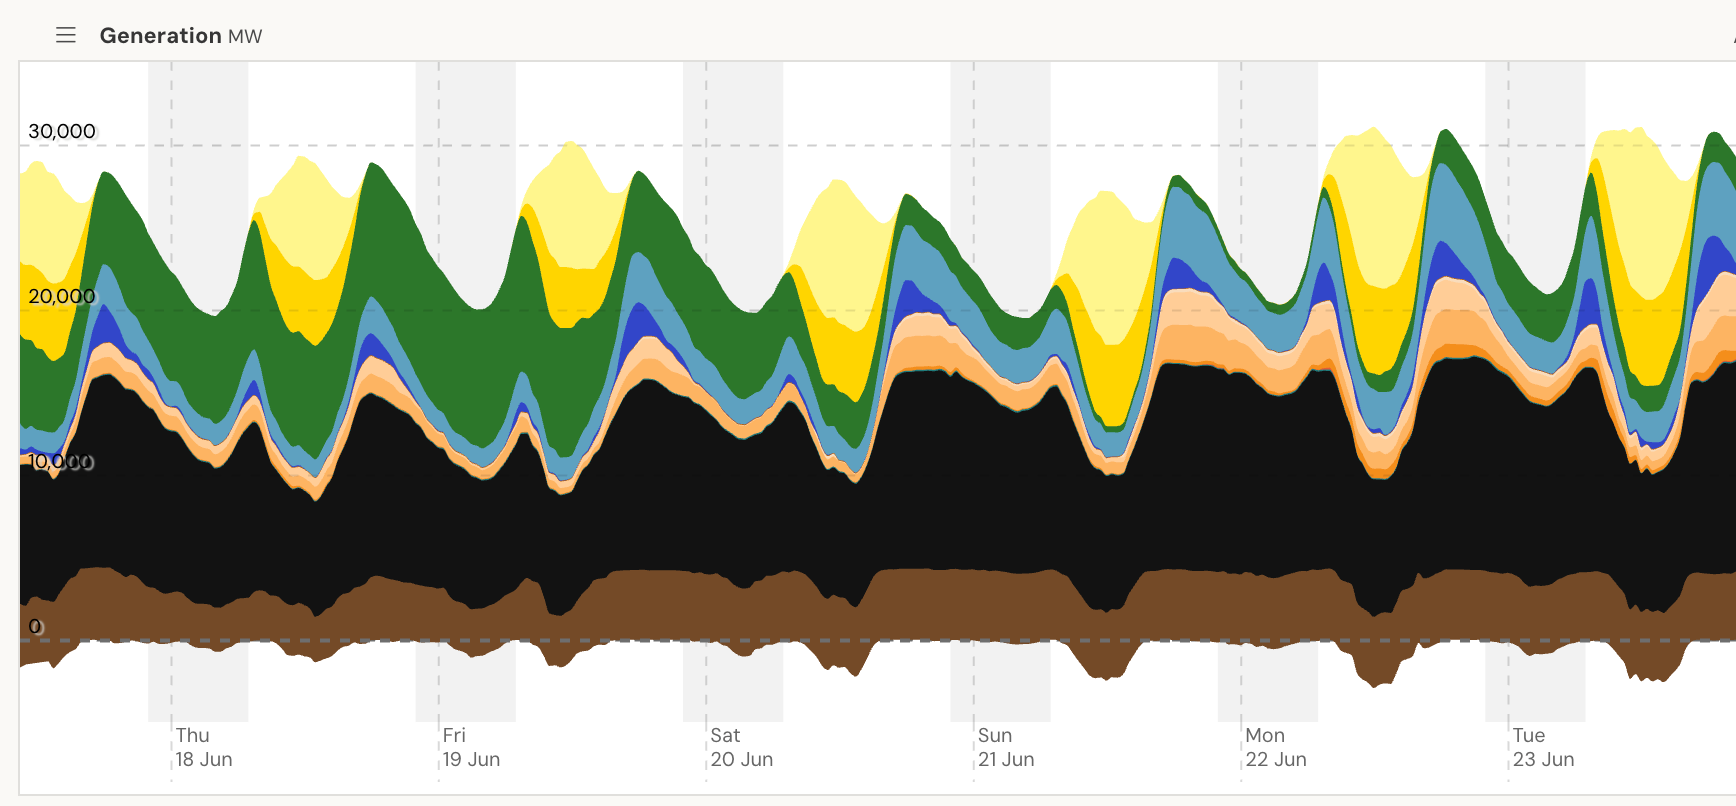
Such a degree of correlated NEM-wide wind drought is unusual, but not unprecedented. What was highly unusual was to go from a near record output to a near record lull… and then back again.
As mentioned earlier, this correlation is an economically rational outcome of early developers building assets in the windiest locations to maximise capacity factors (within the constraint of choosing sites which can connect to the existing transmission system). The majority of the NEM’s wind fleet are on run-of-meter PPAs where the asset owner receives a fixed price and the contract buyer, the offtaker, receives the wholesale spot price (and probably also green certificates). For the asset owner the name of the game is maximising produced volume, hence windy locations go for a premium.
The statement “it’s always windy somewhere” is a bit clichéd, but “it’s not always windy in locations where there is currently a wind farm” is probably truer.
Narrative 6 – Gas
And with a wind drought comes gas. South Australia is a small interconnected market and since privatisation and joining the NEM in 1997-98, the only thermal generation built has been gas – both combined cycle gas turbines which were all the rage in the early 2000s for baseload and intermediate duty, and open cycle gas turbines for peaking duties.3
In the post-privatised landscape and before large scale renewables were sufficiently cheap enough CCGTs were all the rage for private capital seeking to deploy low-ish cost capex generation infrastructure (with high operating costs).
With the wind dying down, no solar overnight, no coal-fired units since 2015, no hydro-electric units and constrained interconnector imports from Victoria (foreshadowing…), gas is the fuel which powers South Australia.
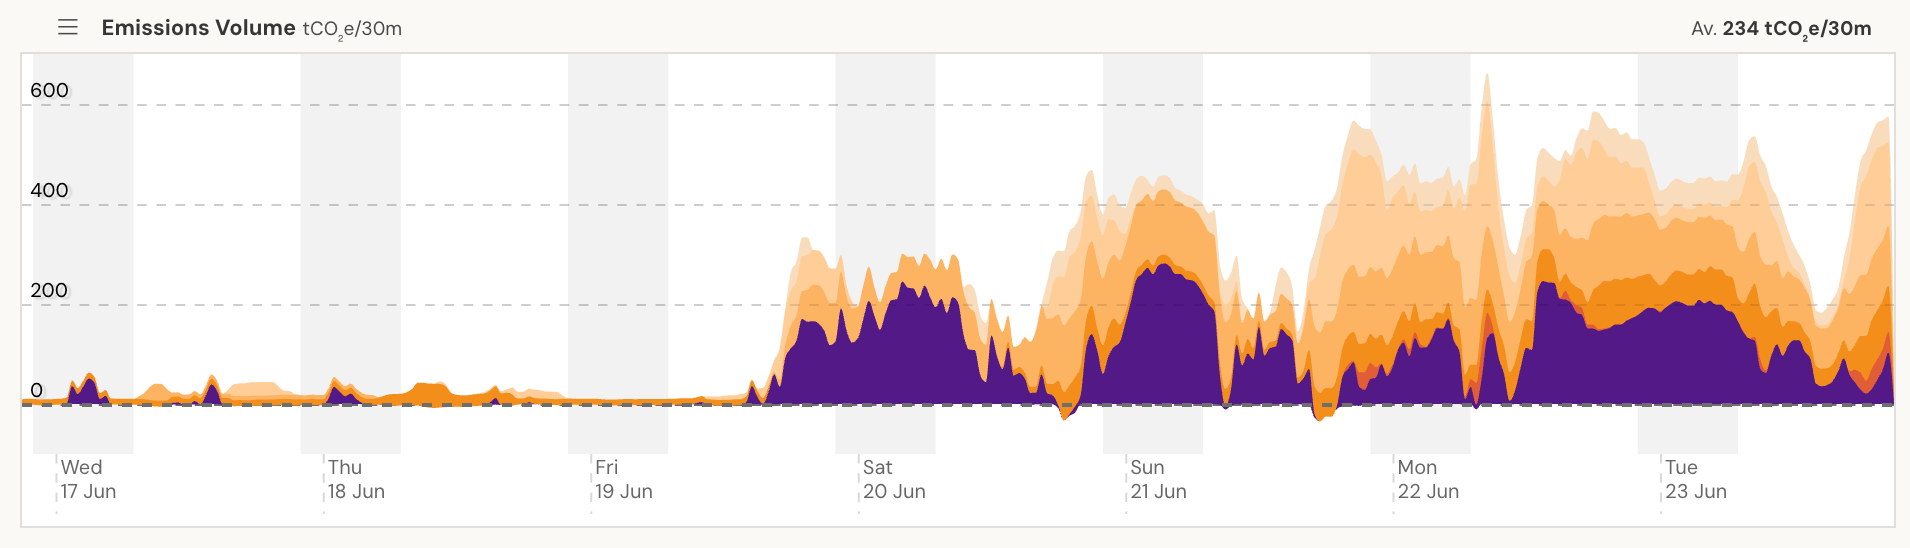
The social media posts got a bit muddled here, because anti-renewables commentators looking to make a point accurately pointed to “gas saving the day” and some more learned posters leaned into the point that gas peakers will likely play an increasingly important role in the energy system as coal units continue to retire.
However the point missed by many commentators is that gas plays a rather different role in SA than the other mainland states – pointing out that gas generation underpins the South Australian electricity system is bit like explaining that water is wet to a fisherman.
Narrative 7 – Volatility
Volatility is always the point where energy stories cross over into the op-ed sections of tabloids, and this week was no different. Anytime the spot price hits the market cap it triggers automatic “MaRkEt Is BrOkEn” rhetoric, and initiates a race of articles to attempt to explain electricity markets as poorly as possible.
But before I talk about what happened, we need a refresher.
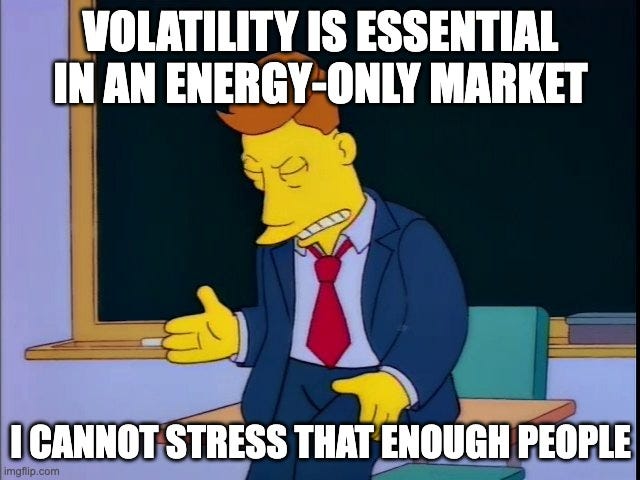
THIS IS YOUR SEMI-ANNUAL REMINDER THAT SPOT PRICES HITTING THE MARKET CAP IS NOT AN INDICATION OF MARKET FAILURE.
In an energy-only market, volatile spot prices serve as both an investment signal, and fundamental cost recovery for peaking generation (which by definition only run for short periods of time).
Brush up on your energy-only vs capacity debate here.
So what happened?
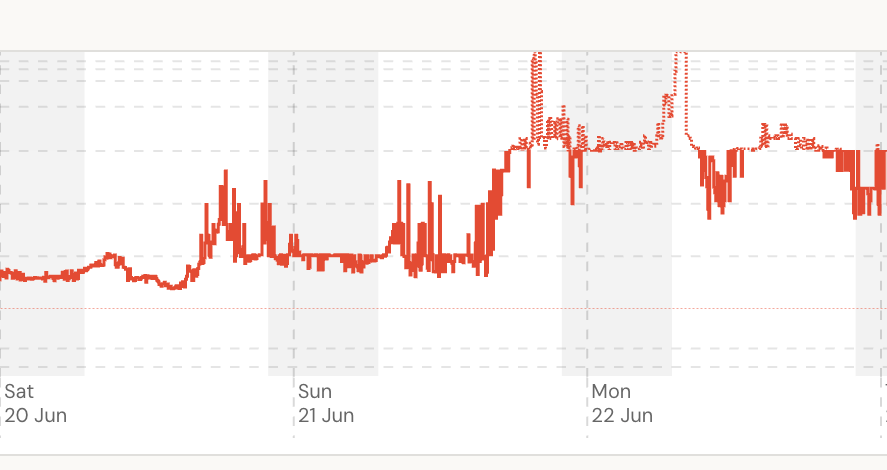
Prices hit the market price cap of $20,300/MWh for two non-consecutive 5-minute intervals on the evening of Sunday 21 June (surrounded by high priced intervals below the cap as it bounced around a bit).
And again for a continuous 30-minute stretch early on Monday morning.
Hell, even noted electricity commentator and gifted orator Pauline Hanson had something insightful to say about the matter, helpfully advising us that “South Australia nearly ran out of power” and “boiling a kettle would cost $5”4
However the much more interesting story wasn’t that the price hit the cap – that’s entirely expected during a wind drought with a constrained interconnector (fooooooreshadowing…) – it’s that it only did so for such a short period…
Narrative 8 – Caps
… which strongly suggests that the South Australia gas fleet was long on cap products sold on the ASX Energy futures.
ASX caps serve as an important insurance product in the NEM5 — buyers of caps pay a premium to ensure that they are never exposed to spot prices above $300/MWh, and sellers are provided with a stable revenue stream of those premiums.
Over Sunday night – a dark still night when South Australia was largely powered by gas – the spot price hovered around $300/MWh, strongly suggesting that gas generators were defending a long cap position and suppressing the spot price.
Is this a good thing? I’ll leave that question for the reader to contemplate.
But it did make for some interesting charging dynamics for South Australia’s fleet of batteries…
Narrative 9 — Batteries
… One of the emerging NEM narratives is that of BESS6 eating the lunch of gas during volatility. Which did happen – you can see the large chunk of blue pushing back the orange gas peak on the evening of both Saturday and Sunday.
The installed fleet of BESS in South Australia are all 2 hour duration or shorter, so there’s only so long they can discharge into the evening peak before they run out of juice.
It’s probably also reasonable to assume that the tsunami of behind-the-meter batteries installed by the Cheaper Home Battery Scheme also contributed at least somewhat to the dynamics here (but we can’t see them in the operational data).
But what happened on Monday morning? Where were the batteries for that second, larger price spike?
Well, the Monday morning price spike didn’t really show up in pre-dispatch – the basis for many price forecast systems – and there was instead a price spike forecast for Monday evening.
With prices hovering around $300/MWh all evening, most batteries didn’t see an economic opportunity to recharge, and were instead waiting for the low cost solar period on Monday.
The dynamics behind this are actually quite interesting and friend of the newsletter and general NEM guru Allan wrote about it over on Watt Clarity if you’re interested.
In fact, if you check the timing of the first price spike on Sunday the batteries actually missed it — by discharging into the market they ended up suppressing price somewhat.7
But one key takeaway here is a reminder that the dispatch mechanics of BESS are much more complicated than “buy low sell high”.
Narrative 10 – The System
One of the narratives which regularly pops up in relation to the high penetration of wind and solar in South Australia is for chuds to gleefully point out that South Australia is reliant on imports from Victoria, often brown coal.
The NEM is *inhales deeply* – BY FUCKING DEFINITION — an interconnected system. That quite literally underpins the entire design. South Australia has been connected to Victoria since 1989 – nearly a decade prior to the start of the NEM – and proposals for interconnectors go back even further.8
So yes, when the wind doesn’t blow, South Australia is reliant on import. Water is wet and all that.
In the case of last week, the more interesting story is actually around what the interconnectors weren’t doing – Heywood was importing from Victoria as expected but MurrayLink got stuck exporting back into Victoria. The reasons for this are way, way beyond the scope here, but I would encourage you to read Allan’s article if you’re curious.
Narrative 11 — Reliability
The final narrative relates to reliability. Commentators, including the racist ranga from Ipswich, were quick to say that the market had failed and South Australia was mere megawatts from blacking out again.
It wasn’t, and I remind you that prices and reliability are distinct concepts.
One weird quirk – AEMO sent out a couple of phantom Lack of Reserve (LOR) market notices (the mechanism for signalling operational reliability concerns to the market) noting that they did not regard them as real.
As noted right at the top, we’re in an El Niño phase and peak demands weren’t super peaky, so despite the lack of wind and weird interconnector behaviour, the system wasn’t particularly stretched.
Interesting (to me at least) is that AEMO is currently working through an overhaul of the LOR framework as part of the ST PASA Replacement Project. I could be drawing false conclusions, but the events of last week do seem symptomatic of the challenges with the current design of the LOR framework, and phantom LOR notices point to why AEMO might be wanting to replace it with something better able to accommodate modern grid conditions.
Narrative 12 – Are there lessons here?
What can we actually learn from last week?
Everything and nothing — pundits saw what they wanted to see. Those with agendas picked out one or two narratives and pushed out messages to suit their ends.9
Every one of these narratives was true, but in isolation none of them are particularly insightful. I personally think it’s useful to avoid framing these individual narratives as “good” or “bad”; they’re consequences of an extremely complicated system.
Because for me that’s the biggest takeaway — the National Electricity Market is the most complicated system we’ve built in this country, and it is currently in transition. New technologies are entering the system and mature ones are exiting. The investment landscape has changed dramatically over three decades as has the companies operating these assets – including the algorithms and homeowners which now steer increasingly large amounts of the system.
The headline narrative might be that the system is increasingly dependent on weather, but more subtly the underlying topology of the network is shifting creating more complicated sets of constraints and network flows, challenging the jobs of AEMO and market participants.
Whether these changes are happening efficiently is a whole other can of worms, but I think we can all agree that things are complex, stay off Twitter.
PS it’s really windy in South Australia again and the NEM just set an all time wind record. Let another discourse cycle begin. 😘
PPS Basslink’s gap year has officially ended and it began life as a regulated interconnector.
And in other less savoury parts like the crumbling castle of Meta’s flagship Facebook and the cesspool formerly known as Twitter.
That article is now over 2.5 years old and the volume of negative prices has continued to climb. What has changed is that the arse has fallen out of the LGC market, and the depth of negative prices has decreased.
SA also has the Torrens Island plant commissioned in the 1960s which burns gas in a boiler to produce steam, and the Barkers Inlet gas/diesel reciprocating engines commissioned in 2017.
Her maths is correct… if you were on a wholesale spot pass through contract and desperate for a cup of tea right at that moment. She and other commentators of course miss the point about long run savings, but volatility has always been scary and Pauline has never been particularly strong on detail or the bigger picture.
Not technically part of the NEM, but that’s a nuance which is beyond our scope here.
Battery Energy Storage System, for the pedants out there. True pedants would point out that it should be a Chemical Battery Energy Storage System, and even bigger pedants would point out that they should be Lithium Chemistry… ok ok ok I’ll stop.
This is the energy equivalent of the grandfather paradox — if you don’t discharge the prices probably will like spike, but by discharging you ensure that prices do not spike.
Sir John Monash pitched the seemingly prescient idea of a “linking up scheme” in 1924. But that’s a story for another day.
At the extreme this falls into both “renewables are awesome” and “gas is good haha stupid unreliables”. This is reductive, but so are most LinkedIn posts.